Agent Observability Is the Next Observability


Why logs, metrics, and traces are no longer enough for production AI.

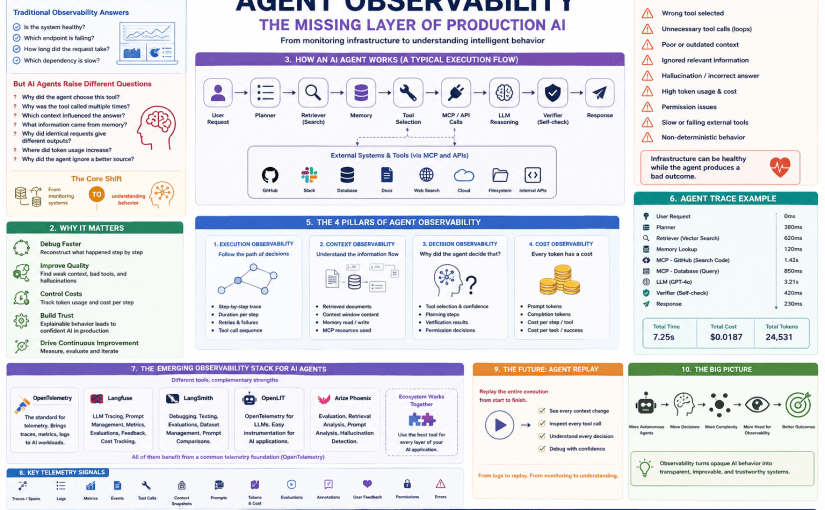
TL;DR: Modern AI agents are not just making API calls—they are making decisions. Traditional observability tells us whether a system is healthy. Agent observability tells us why an agent behaved the way it did. That distinction will define the next generation of production AI.


We Solved Infrastructure Observability. AI Introduces a New Problem.

Over the last decade, software engineering has become incredibly good at observing distributed systems.

We have mature tools for:

  • Logs
  • Metrics
  • Distributed traces
  • Profiling
  • Alerting
  • Service maps

Platforms such as OpenTelemetry, Prometheus, Grafana, Datadog, and Jaeger have made production debugging dramatically easier.

When an API slows down, we can usually answer questions like:

  • Which service caused the latency?
  • Which database query was expensive?
  • Which deployment introduced the regression?
  • Which dependency failed?

For cloud-native applications, these questions are routine.

But AI agents change the nature of the problem.

Infrastructure can be perfectly healthy while the agent produces a completely incorrect result.

That is a fundamentally different debugging challenge.


AI Agents Behave More Like Employees Than APIs

Traditional software follows deterministic code paths.

AI agents don’t.

Instead, they continuously make decisions.

For example:

Receive task
        │
        ▼
Plan execution
        │
        ▼
Search documentation
        │
        ▼
Read memory
        │
        ▼
Choose tools
        │
        ▼
Call GitHub
        │
        ▼
Call MCP Server
        │
        ▼
Query database
        │
        ▼
Generate answer
        │
        ▼
Self-evaluate
        │
        ▼
Return response

Every arrow represents a decision.

Every decision can influence the final outcome.

This means debugging an AI agent is much closer to investigating a workflow than diagnosing a REST API.


Traditional Observability Doesn’t Explain Behavior

Imagine this production log:

POST /chat

Status: 200
Latency: 7.2 seconds

Everything appears normal.

But what actually happened?

Perhaps the agent:

  • Retrieved outdated documentation.
  • Selected the wrong MCP tool.
  • Called GitHub four times.
  • Ignored the highest-confidence search result.
  • Consumed 250,000 tokens.
  • Produced an incorrect answer anyway.

None of this appears in traditional monitoring.

The infrastructure succeeded.

The agent failed.


The Questions Production Engineers Actually Ask

When debugging production AI, engineers rarely ask:

“Was the CPU overloaded?”

Instead, they ask:

  • Why was this tool selected?
  • Why was this tool selected three times?
  • Which retrieved document influenced the answer?
  • Which prompt version was used?
  • Which memory entry changed the decision?
  • Why did identical requests produce different outputs?
  • Which context caused hallucination?
  • Why did token cost suddenly double?

Notice something interesting.

These are not infrastructure questions.

They are behavioral questions.


The Four Pillars of Agent Observability

I believe future observability platforms will revolve around four primary dimensions.


1. Execution Observability

This is the closest equivalent to distributed tracing.

Instead of following network calls, we follow decisions.

Example:

User
 │
 ▼
Planner
 │
 ▼
Retriever
 │
 ▼
Memory
 │
 ▼
GitHub
 │
 ▼
Filesystem
 │
 ▼
MCP
 │
 ▼
LLM
 │
 ▼
Verifier
 │
 ▼
Response

Each node represents a reasoning step rather than simply a service.


2. Context Observability

Context is rapidly becoming one of the most valuable assets inside an AI application.

Questions include:

  • Which documents entered the context window?
  • Which documents were discarded?
  • Which memories were loaded?
  • Which MCP resources were exposed?
  • Which retrieval strategy was used?

Poor context often explains poor answers.


3. Decision Observability

Understanding what happened is useful.

Understanding why it happened is even more valuable.

Useful telemetry might include:

  • Tool selection
  • Confidence scores
  • Retry decisions
  • Permission checks
  • Planning steps
  • Verification outcomes

This transforms debugging from reading logs into understanding behavior.


4. Cost Observability

AI systems introduce an entirely new production metric.

Cost.

Every execution now has measurable resource consumption.

Useful metrics include:

  • Prompt tokens
  • Completion tokens
  • Cost per request
  • Cost per tool
  • Cost per workflow
  • Cost per successful outcome

Organizations will increasingly optimize agents not only for accuracy but also for efficiency.


MCP Makes Observability Even More Important

The Model Context Protocol (MCP) expands what agents can access by standardizing connections to tools, data sources, and external services.

Instead of isolated LLM calls, agents can interact with GitHub, databases, documentation systems, cloud services, and internal business platforms through a common interface.

That flexibility is powerful—but it also increases operational complexity.

An agent may execute multiple MCP tool calls before producing a response.

Questions quickly emerge:

  • Which MCP server was used?
  • Which tool was selected?
  • Which parameters were passed?
  • How long did each tool take?
  • Which call failed?
  • Which permissions were granted?
  • Was the returned data actually used?

As MCP adoption grows, execution traces will need to include tool interactions as first-class citizens rather than treating them as opaque external calls.


Existing Tools Are Building the Foundation

The ecosystem is already moving toward this future.

OpenTelemetry

OpenTelemetry standardized telemetry for cloud-native software.

It gave us a common language for logs, metrics, and distributed traces.

Many emerging AI observability platforms are extending these concepts rather than replacing them.

The opportunity is to enrich traces with AI-specific events such as tool invocations, prompt versions, token usage, and retrieval metadata.


Langfuse

Langfuse focuses on LLM tracing, prompt management, evaluations, and production monitoring.

It provides visibility into:

  • Prompt execution
  • Token usage
  • Costs
  • Latency
  • User feedback
  • Evaluations

For many teams, it serves as an operational dashboard for AI applications.


LangSmith

LangSmith emphasizes debugging and evaluating LLM-powered applications.

It helps developers inspect execution flows, compare runs, evaluate prompts, and identify regressions.

This is especially valuable during iterative development and testing.


OpenLIT

OpenLIT brings OpenTelemetry concepts into AI workloads.

Rather than creating an entirely separate observability stack, it extends familiar telemetry patterns to LLMs, vector databases, and AI frameworks.

This approach is attractive for organizations already invested in OpenTelemetry.


Arize Phoenix

Arize Phoenix focuses on evaluating and diagnosing AI systems.

Its strengths include:

  • Retrieval analysis
  • Hallucination investigation
  • Embedding visualization
  • Prompt inspection
  • LLM evaluations

Instead of monitoring infrastructure health, it helps teams understand model behavior and output quality.


The Next Evolution: Agent Replay

Perhaps the most valuable capability isn’t another dashboard.

It’s replay.

Imagine opening a production incident and replaying an entire agent execution:

  • Every retrieved document
  • Every MCP tool invocation
  • Every prompt
  • Every model response
  • Every retry
  • Every permission decision
  • Every context update

Instead of reading thousands of log lines, engineers could simply watch the execution unfold.

Distributed tracing transformed backend debugging.

Execution replay could do the same for AI agents.


What an Ideal Agent Trace Might Look Like

User Request
        │
        ▼
Planning
        │
        ▼
Memory Lookup
        │
        ▼
Vector Search
        │
        ▼
MCP GitHub Tool
        │
        ▼
Repository Analysis
        │
        ▼
LLM Reasoning
        │
        ▼
Verification
        │
        ▼
Response

Clicking any node would reveal:

  • Execution time
  • Tokens
  • Cost
  • Context
  • Prompt version
  • Tool parameters
  • Output
  • Evaluation results

This level of visibility would make AI systems significantly easier to operate and improve.


Why This Matters for Software Engineering

The software industry has spent years building reliable systems through observability.

AI agents introduce a new abstraction layer where the primary source of failure is no longer infrastructure—it is behavior.

Healthy services can still produce poor outcomes if the agent chooses the wrong tool, retrieves irrelevant context, or follows an ineffective execution path.

That means the next generation of engineering practices must evolve beyond monitoring systems to understanding autonomous workflows.

Observability is no longer just about uptime.

It is about explainability, accountability, and operational confidence.


Final Thoughts

Cloud-native engineering gave us logs, metrics, and traces.

Production AI will require something more.

As AI agents become responsible for software development, customer support, security investigations, business workflows, and autonomous operations, understanding how they reached a decision will become just as important as knowing what they returned.

The teams that succeed won’t simply build more capable agents.

They will build agents that can be observed, replayed, evaluated, and trusted.

Because in production, intelligence without observability is just another black box.


Key Takeaways

  • Traditional observability explains system health; agent observability explains agent behavior.
  • AI agents require visibility into decisions, context, tool usage, and execution paths.
  • MCP increases the need for rich tracing because agents interact with many external tools and services.
  • Emerging platforms such as OpenTelemetry, Langfuse, LangSmith, OpenLIT, and Arize Phoenix are laying the groundwork for AI-native observability.
  • The next major evolution is likely to be agent replay, enabling engineers to reconstruct and analyze complete autonomous workflows rather than relying solely on logs.

What are these? SLI SLO SLA


In today’s competitive market, customer satisfaction is crucial for the success of any business. Implementing SLIs, SLOs, and SLAs can help companies to deliver high-quality services and products to their customers. By continuously measuring and analyzing performance metrics, companies can identify areas for improvement and implement changes that enhance the customer experience. This proactive approach can increase customer loyalty, drive sales, and ultimately boost the bottom line of the business.

However, it is essential to remember that SLIs, SLOs, and SLAs are not a one-size-fits-all solution. Different industries, companies, and even customers have different expectations and requirements. Therefore, it is crucial to develop customized SLIs, SLOs, and SLAs that align with the specific needs of each business and its customers. Regularly reviewing and updating these metrics based on feedback and changing market conditions is also critical to ensure their effectiveness.

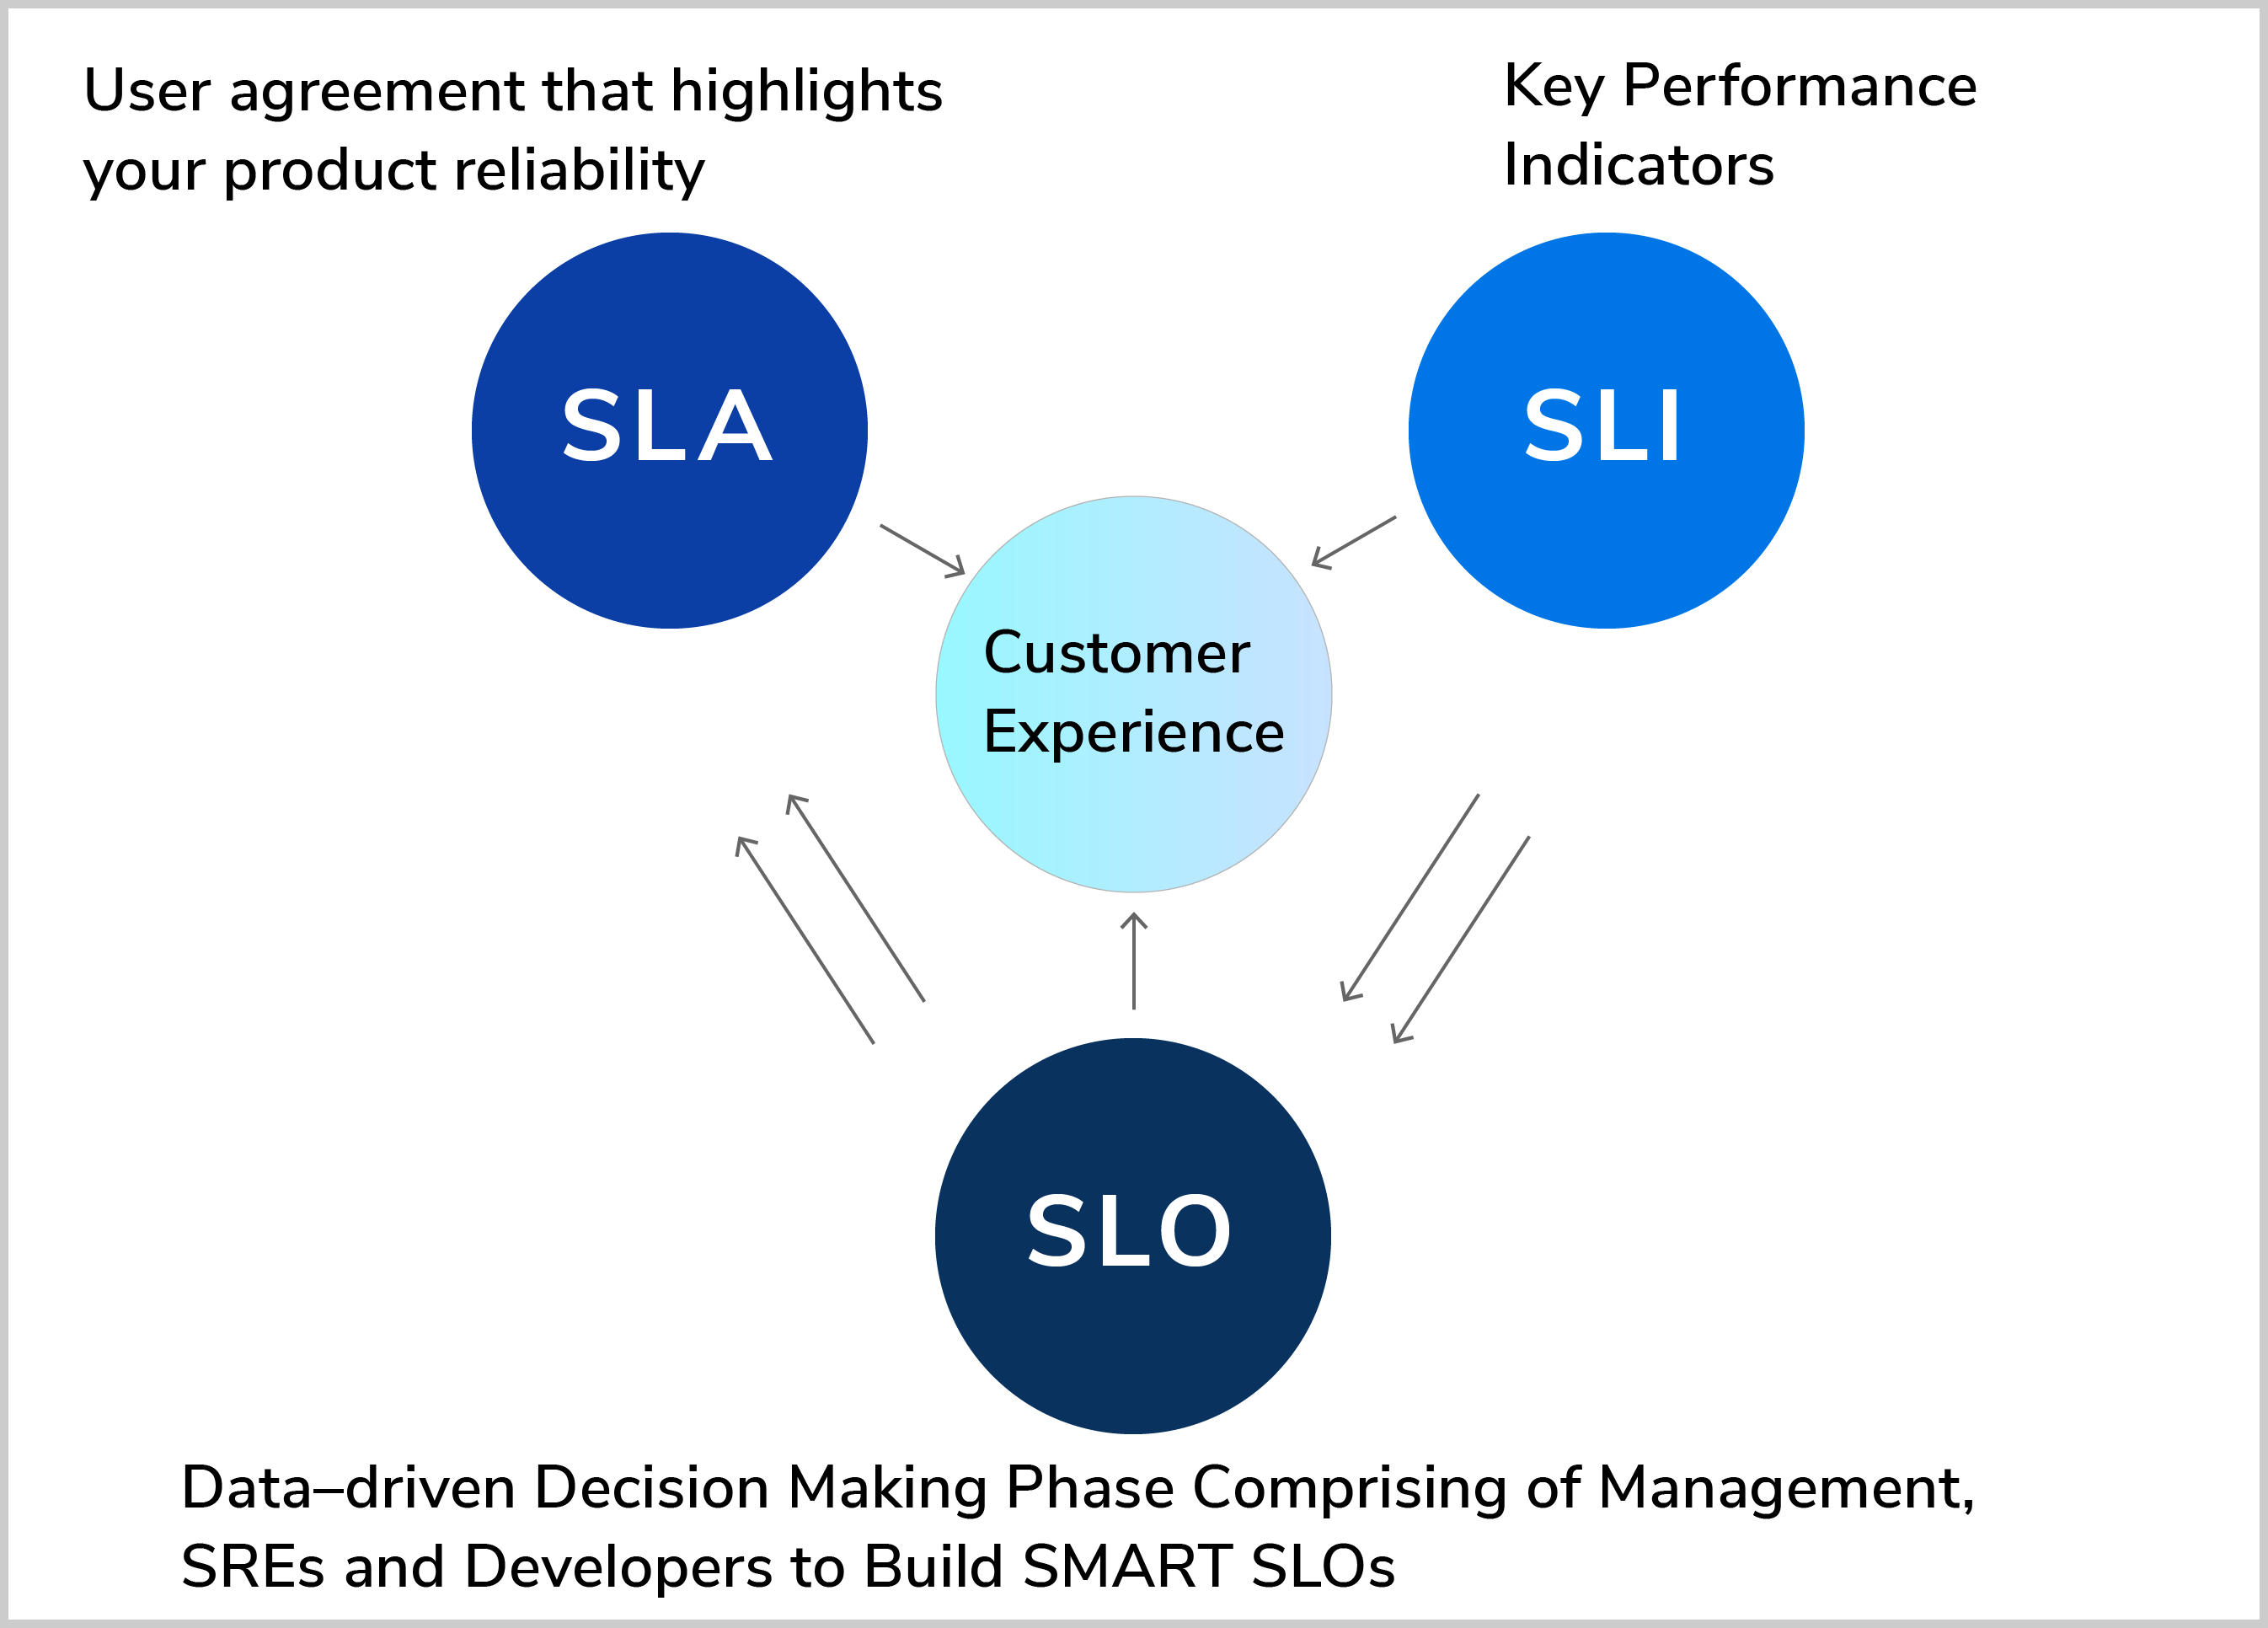
SLIs, SLOs, and SLAs are terms commonly used in the business and technology industries to measure and improve the quality of service provided to customers.

SLIs are technical metrics used to assess the performance of a system, such as response time or error rates. SLOs are goals that companies set for their service level, based on SLIs, to ensure that the service meets customer expectations. SLOs are typically expressed as a percentage or ratio, such as “99.9% uptime.”

SLAs are contracts that specify the level of service a company will provide to customers based on SLOs. SLAs outline the consequences of failing to meet these objectives and ensure companies are accountable for the quality of service they provide.

These concepts are essential as they provide a framework for measuring and improving the quality of service provided. By setting clear objectives and metrics, companies can ensure that their services meet customer expectations. SLAs, in particular, provide a way to hold companies accountable for their service quality.

In conclusion, implementing SLIs, SLOs, and SLAs can help businesses to deliver high-quality services and products that meet or exceed customer expectations. These concepts provide a framework for measuring and improving service quality, enabling companies to identify areas for improvement and make proactive changes. By developing customized metrics and regularly reviewing and updating them, businesses can ensure that they remain relevant and effective in a rapidly changing market.

where to start WEB3


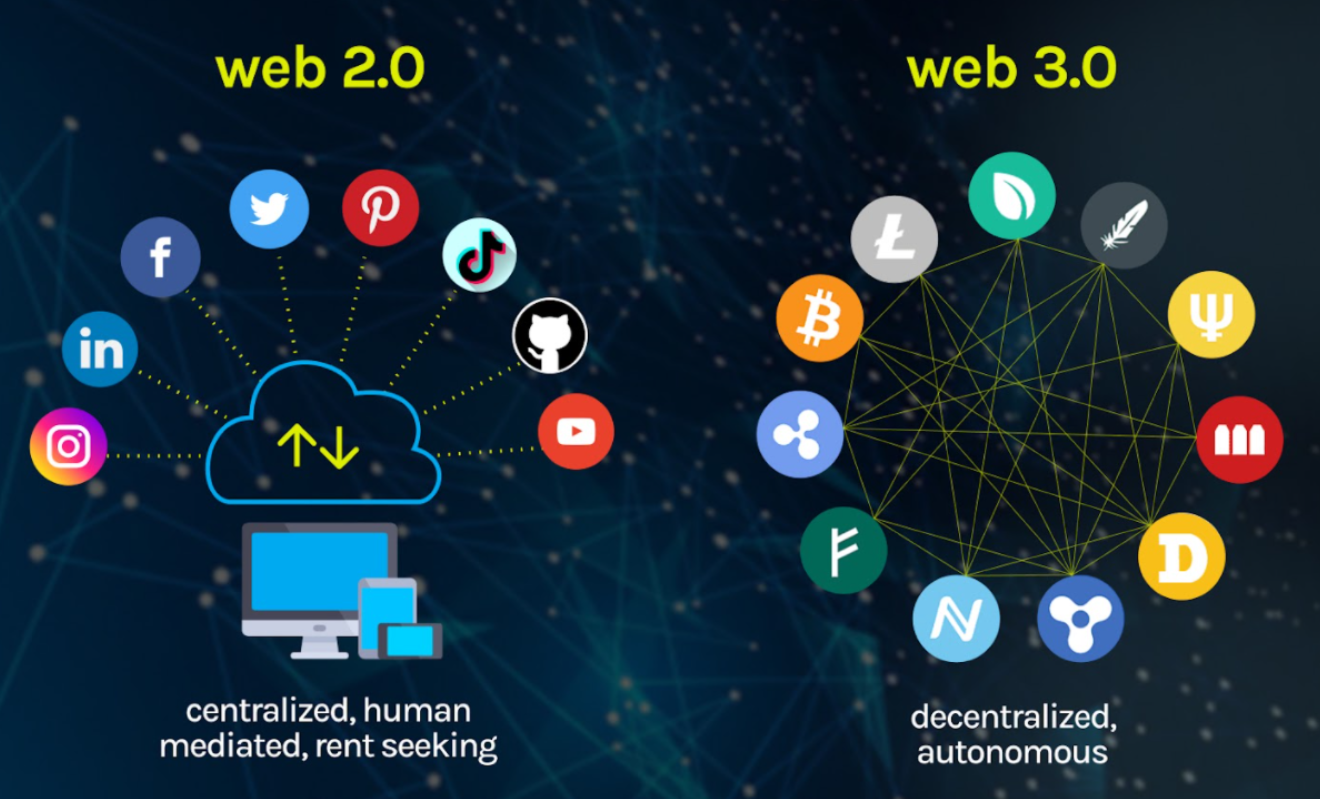
Web3, also known as Web 3.0, is a significant advancement in the internet landscape. It shifts the focus from centralized systems to decentralized networks, giving individuals more control over their data and online experiences. This transition is enabled by the use of blockchain technology, which enables the creation of decentralized applications (dApps) and smart contracts. For developers interested in exploring and working with web3, there are several steps they can take to acquire a comprehensive understanding of the technology.

To gain a comprehensive understanding of web3, developers can take the following steps:

  1. Familiarize themselves with blockchain technology: Blockchain technology is the foundation of web3, so it’s essential for developers to have a solid grasp of blockchain concepts. This can be done by studying the original Bitcoin whitepaper and delving into more advanced topics such as consensus algorithms, smart contracts, and decentralized applications. One example of a blockchain concept is the “Proof of Work” consensus mechanism used by Bitcoin. (or POS, POST can be examined)
  2. Learn Solidity: Solidity is the most widely used programming language for writing smart contracts on the Ethereum blockchain, which is currently the most popular blockchain for web3 applications. Developers can familiarize themselves with Solidity by reading documentation, participating in online tutorials, and creating their own smart contracts. For example, a smart contract can be a simple escrow contract that holds funds until certain conditions are met.
  3. Build decentralized applications (dApps): Building dApps is an excellent way for developers to gain hands-on experience with web3. Developers can start by creating simple dApps using existing tools such as Truffle and Embark and then progress to more complex projects as they become more comfortable with the technology. A good example of a dApp is a decentralized marketplace where users can buy and sell goods without intermediaries.
  4. Join the web3 community: The web3 community is a dynamic and supportive group of developers, entrepreneurs, and enthusiasts who are working to build the next generation of the internet. Joining online forums, attending meetups, and participating in hackathons are great ways to connect with other web3 developers and learn from them. For example, the Ethereum community is a great place to learn about web3 and get involved in projects.
  5. Keep an eye on new developments: The web3 space is evolving rapidly, with new developments happening all the time. Developers need to stay current with the latest news and trends to be able to build innovative web3 applications. For example, new blockchain protocols like Polkadot, Cosmos, and Solana are gaining traction and are promising to bring new features and scalability to the web3 ecosystem.

In summary, web3 is the next step in the evolution of the internet, enabled by blockchain technology. Developers can begin by learning about blockchain technology, studying Solidity, building dApps, joining the web3 community, and keeping an eye on new developments. With these steps, developers can gain a comprehensive understanding of web3 and begin creating their own decentralized applications.

Spiral Model in Software Development


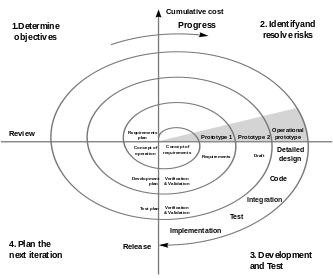
The Spiral Model is a software development approach that incorporates elements of both the Waterfall and Agile methodologies. Developed by Barry Boehm in 1986, it is specifically designed to handle the complexities and risks associated with large-scale software development projects. The model is divided into four distinct phases that are repeated iteratively throughout the development process, each iteration representing a “spiral” of the development process. These phases include Planning, Risk Analysis, Engineering, and Evaluation. In the Planning phase, the goals and objectives of the project are identified and the scope of the project is defined. During the Risk Analysis phase, any potential risks are evaluated and strategies are developed to mitigate them. The Engineering phase is used to implement the project using these strategies, with testing and quality assurance conducted to ensure that the project meets the defined goals and objectives. Finally, the Evaluation phase is used to review the project’s performance and identify any lessons learned that can be applied to future projects.

The Spiral Model is a suitable approach for tackling large-scale and complex software development projects, as it allows for flexibility and incremental progress. Additionally, it enables early identification and mitigation of risks, reducing the project’s overall risk. Furthermore, the model incorporates customer feedback throughout the development process, ensuring that the final product satisfies customer needs.

Some well-known companies that have employed the Spiral Model approach in their software development process include aerospace and defense giant Lockheed Martin, who used it in the development of their missile systems and other defense-related software. Technology leader IBM has used this approach in the development of its enterprise software products, such as IBM WebSphere and IBM Rational Suite. Telecommunications company Ericsson has used the Spiral Model approach in the development of their network management systems and other telecom-related software. American multinational corporation Boeing has used this approach to develop its avionics systems and other aviation-related software. NASA, the American space agency, has used the Spiral Model approach in the development of its mission control software and other space-related systems. The Spiral Model approach is widely adopted by many organizations and has a proven track record of success.

In summary, the Spiral Model is an iterative and incremental method of software development that strikes a balance between the traditional Waterfall model and Agile methodology. Its suitability for large-scale and complex software development projects and its ability to manage risk and incorporate customer feedback makes it a widely adopted method by many organizations, which has been proven to be successful in many cases.

Re-platforming Monoliths


Replatforming a monolithic software architecture to a microservices-based architecture has many benefits, including increased scalability, improved maintainability, and greater flexibility. One approach to replatforming is to use a promise-based solution, which can help to simplify the process and minimize the impact on existing systems.

A monolithic architecture is characterized by a single, large codebase that handles all aspects of the application. This can lead to poor scalability, as the entire application must be deployed and scaled together. Additionally, changes to the codebase can be difficult to implement and test, as they may have unintended consequences on other parts of the application.

In contrast, a microservices-based architecture is characterized by a collection of small, independently deployable services that communicate with each other through APIs. This allows for greater scalability, as each service can be scaled independently of the others. Additionally, changes to a single service can be made and tested without affecting the entire application.

Promise-based solutions can help to simplify the replatforming process by breaking the monolithic architecture into smaller, more manageable services. A promise is an object that represents the eventual outcome of an asynchronous operation, allowing developers to write asynchronous code that is easier to read and understand.

When replatforming a monolithic application to a microservices-based architecture, a promise-based solution can be used to manage the transition. For example, a promise can be used to wrap a monolithic service and provide a consistent interface for interacting with it, while the underlying service is gradually broken down into smaller, more manageable services.

Additionally, promise-based solutions can be used to handle the communication between services, which can help to ensure that the re-platforming process has minimal impact on existing systems.

In conclusion, re-platforming a monolithic software architecture to a microservices-based architecture can bring many benefits. Using a promise-based solution can help simplify the process and minimize the impact on existing systems. This approach allows for greater scalability, improved maintainability, and greater flexibility.